This content is not available in English.

developer profile

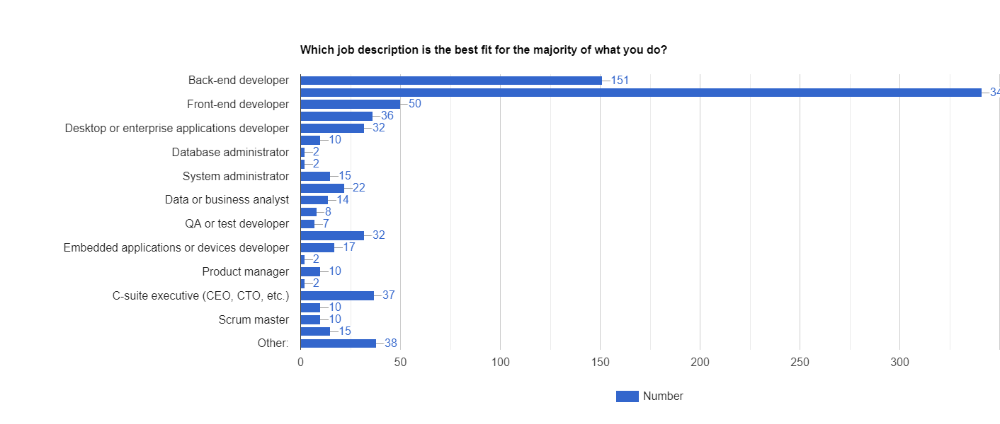
Nearly 40 percent (2019: 38 percent) of participants identify as fullstack developers. Back-end developers account for 17 percent (2019: 14 percent), while front-end developers make up about 6 percent. Mobile developers increased to just over 4 percent (2019: 3 percent). Desktop or enterprise application developers remained at about 6 percent. Despite a large selection, the next largest group could not locate themselves - they are "other."

Also interesting: 37 people, or about 4 percent, are C-level - so appear to be coding or formerly coding leadership.

This is an interesting parallel to some of the largest IT companies such as Google, Amazon, Microsoft or Facebook, where the founders were all once developers themselves.

Open source: Around 10 percent (2019: 9 percent) regularly contribute to open source projects, 37 percent occasionally, 9 have given up and 42 percent have not yet found the time.

Thus, a large proportion of coders (57 percent) contribute or have contributed to open source software development - the very technologies that make most innovation possible in the first place. On the other hand, 43 percent have never contributed to open source, which is very sad because today we owe practically everything in some form to open source.

65 percent of participants code in their spare time. This figure is understandably a little lower among participants with children. Where else can you find a professional group that enjoys doing their job in their "free" time? Perhaps the work-life balance is less of an issue for these software developers, since "work" already counts as "life" for them.

Participants have been coding for a long time: only 26 percent have been doing it for less than 10 years - over 40 percent have been doing it for more than 18 years.

Unlike the preliminary question, this is purely about professional coding. The pattern is similar. However, it becomes clear that many of the participants have been developing software privately for longer than professionally.

12 percent of participants are currently studying or are in formal vocational training - of which 8 percent are studying for a degree such as a bachelor's or master's and 4 percent are studying for diplomas such as CAS, MAS, DAS, COS.

Education: 37 percent hold a bachelor's degree (2019: 38 percent), 38 percent a master's degree (2019: 35 percent) and just over 3 percent a doctorate. The majority of master's degrees are university degrees, while bachelor's degrees are predominantly from universities of applied sciences.

Participants diligently continue their education in more ways than one. The 738 participants in this question attended 1984 different trainings. That's almost three per person. Online training is the absolute leader. No wonder, if you look for frequently viewed video training courses on Udemy, LinkedIn Learning or YouTube, they are almost exclusively software development courses.

When it comes to courses, around 15 percent (2019: 20 percent) favor public events, 40 percent (2019: 36 percent) prefer an in-house trainer and the rest don't care. This represents a 5 percent increase from last year in the percentage of those who prefer in-house training. This sharp shift could be due to Corona.

>Table of contents show detail hide detail